
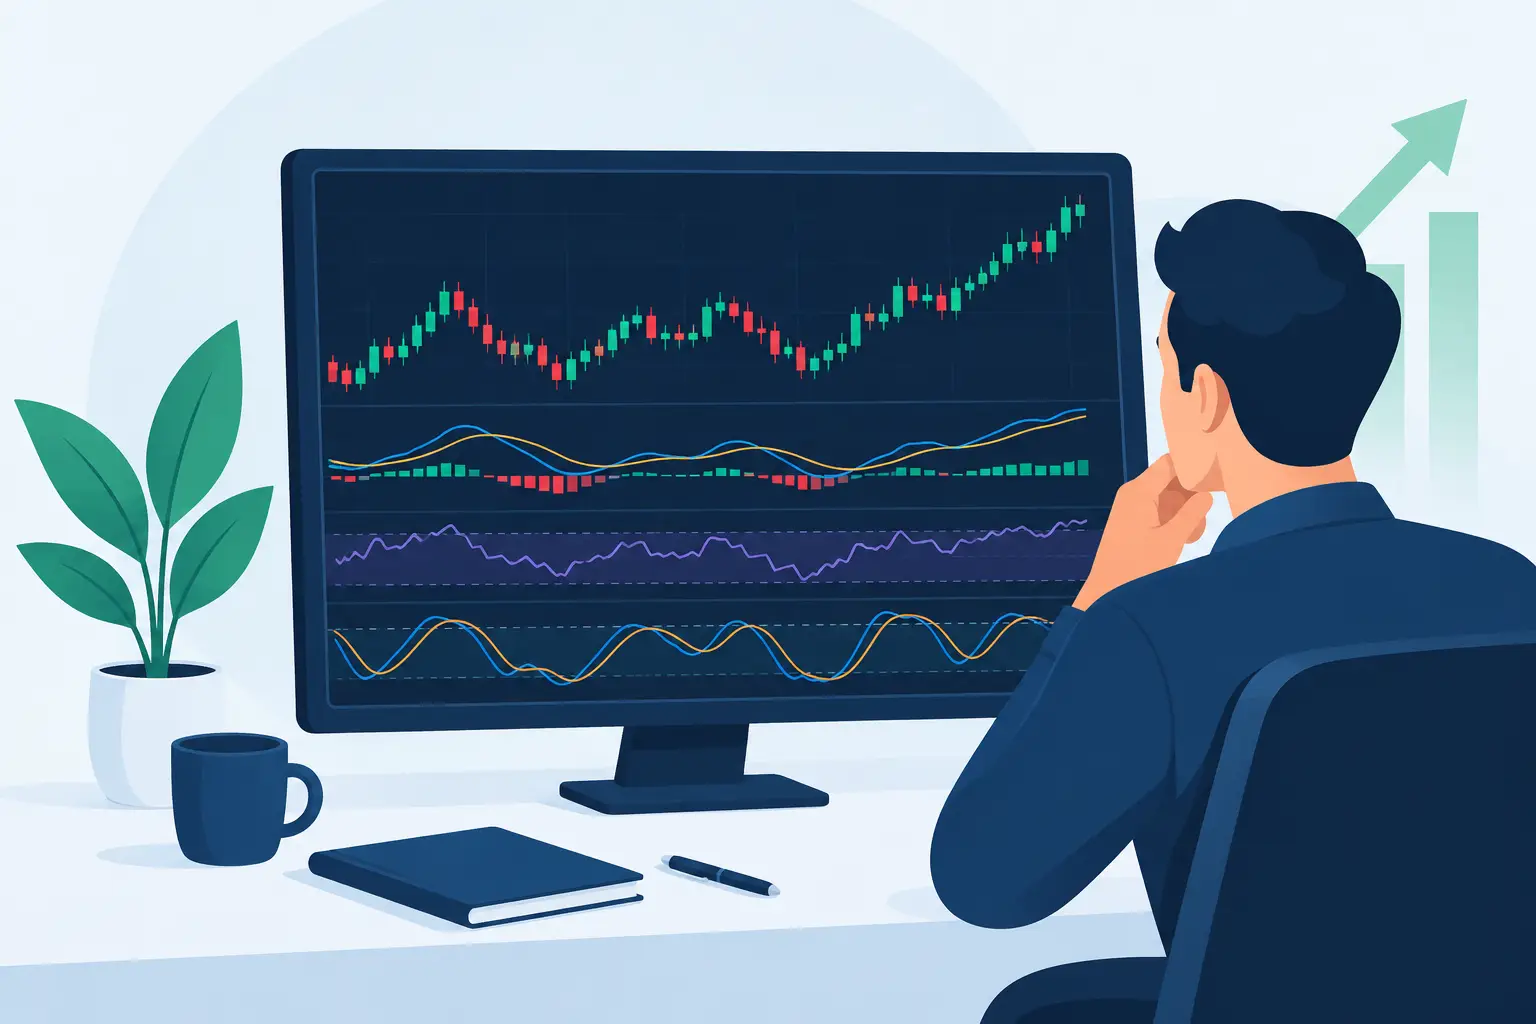
A fast NQ move can travel 30 points before a traditional oscillator finishes telling you momentum is strong. By then, the location is often poor, the stop is wider, and the trade has become a chase. The best NQ trading indicators do not solve that problem by adding more signals. They solve it by putting context before entry.
Nasdaq futures reward speed, but they punish impatience. NQ is highly responsive to liquidity, news, large-cap tech flows, and shifts in risk appetite. A useful charting framework must show where price is trading relative to value, whether real participation supports the move, and where risk is objectively defined. Anything else is decoration.
What the Best NQ Trading Indicators Must Do
Most traders ask which indicator creates the best entry. That is the wrong first question. An entry only has meaning when you know the auction location. Buying a breakout into a major higher-timeframe value zone is different from buying a breakout that has accepted above value and is being supported by active participation.
The best indicators for NQ should help you answer four questions in sequence: Where is value? Is participation present? What is the trade structure? Where does the trade become invalid?
That sequence matters because NQ creates plenty of convincing candles that lead nowhere. A momentum reading can rise while price is running directly into overhead supply. A volume spike can look bullish while trapped buyers are providing liquidity for a reversal. Context filters the signal. It is not you. It is the model when the model starts with a trigger and ignores location.
1. Higher-Timeframe Value Zones
The first indicator category is higher-timeframe value. This includes prior balance areas, accepted value, auction highs and lows, and zones where the market previously spent meaningful time transacting. These are not arbitrary horizontal lines. They are areas where the market has already revealed agreement, rejection, or unfinished business.
On NQ, value zones matter because the contract can move so quickly between them. When price opens inside established value, expect two-sided trade until the market proves otherwise. When it opens outside value, the key question is whether it can hold and build acceptance or whether price is likely to rotate back through the prior range.
A value-zone tool is most useful when it keeps the chart clean. You need to see nearby decision areas without drawing twenty levels that all appear equally important. Focus on zones that affect the current session: the nearest high-timeframe value above and below price, the session’s developing auction, and major reference points that can define risk.
This is where First Light Beacon’s auction-intelligence framework is built to operate: location first, then confirmation and execution. The chart should tell you whether you are trading from an area of opportunity or trading in the middle of noise.
What to look for at value
At a major zone, do not assume support or resistance will hold. Watch the response. A sharp rejection with failed continuation can create a reversal setup. Repeated tests followed by shallow pullbacks can signal absorption and eventual acceptance. The level is not the trade. The behavior at the level qualifies the trade.
2. Order Flow and Participation Tools
Once price reaches a meaningful location, participation decides whether the move deserves your attention. NQ can print a strong-looking breakout on thin commitment, then reverse hard as liquidity disappears. Participation tools help distinguish genuine initiative from a temporary push.
Useful participation data may include relative volume, buying and selling pressure, delta behavior, pace of transactions, or other real-time measures of market involvement. The exact visualization matters less than the question it answers: Are participants actually supporting price in the direction of the trade?
For a long, look for price holding above a reclaimed level while demand remains active on pullbacks. For a short, look for failed acceptance above resistance, stalled upside progress, and selling that takes control as price returns below the reference. You are not trying to predict every tick. You are looking for alignment between location, price behavior, and participation.
There is a trade-off here. Raw order-flow data can be powerful, but it can also overwhelm newer traders. A footprint, depth display, volume profile, and delta chart can become another form of noise when there is no decision process behind them. Use the smallest set of participation inputs that lets you confirm or reject the idea quickly.
3. Structure Indicators for the Actual Trade
A qualified NQ idea still needs structure. This is where many traders lose control. They see confirmation, enter late, then manage the position from emotion because the trade was never designed.
Structure tools should make the entry area, invalidation point, first objective, and potential scale points visible before you click. The best setup is not necessarily the one with the largest projected move. It is the one with a clear reason to enter, a logical stop, and enough room to the next opposing auction level to justify the risk.
For example, imagine NQ rotates down into a higher-timeframe value zone after opening above it. If sellers cannot sustain trade below the zone, participation shifts upward, and price reclaims a nearby intraday reference, the long has a structure. The invalidation is beneath the failed test. The first target is not a random number of points. It is the next known area where sellers may respond.
That is trade with intention. It replaces vague plans such as “I will hold until it feels extended” with decisions that exist before emotion enters the room.
Do not confuse tight stops with controlled risk
NQ traders often force tiny stops because the dollar movement is fast. A tight stop is only efficient when it sits beyond a valid structural point. If normal auction movement can hit the stop, the trade is undercapitalized or poorly located. Reducing size is usually smarter than placing the stop inside the noise.
4. Risk and Trade-Management Indicators
The final category is account protection. Every indicator on the chart should ultimately support better risk decisions, not more trades. If an indicator makes you feel compelled to participate in every move, it is working against you.
A practical risk tool helps define position size, stop distance, daily loss limits, and management rules. It can also help identify when price has reached the first logical target, when risk can be reduced, and when holding the remainder no longer makes sense.
NQ is especially dangerous after a trader takes a quick loss and tries to get it back on the next candle. A visible trade-management plan creates friction between the impulse and the order ticket. That friction protects the account.
Build rules around the conditions you can repeat. If your best setups occur at high-timeframe value with clear participation confirmation, make that your standard. If the market is trading in the center of a balanced range with mixed order flow, stand aside. No indicator can turn bad location into a professional trade.
Why Common NQ Indicators Fall Short Alone
Moving averages, RSI, MACD, and VWAP can all be useful references. They are not automatically bad tools. The issue is using any one of them as a complete decision system.
A moving average can show direction, but it does not tell you whether price is entering supply. RSI can show an extended condition, but NQ can stay extended while auction acceptance drives price much farther. VWAP provides a valuable intraday reference, yet a VWAP cross means little without knowing whether the market is rotating within value or breaking into a new area of acceptance.
Use conventional indicators as supporting evidence, not as the authority. A clean value map and participation read should carry more weight than a crossover that appears after the move is already mature.
Build a Four-Layer NQ Chart
A disciplined NQ chart does not need to be crowded. It needs to organize decisions in the right order.
Start with higher-timeframe value zones. Add a participation measure that shows whether buyers or sellers are committed at those areas. Use trade-structure tools to plan entry, stop, and objectives. Then add risk controls that keep a normal losing trade from becoming an account-level problem.
Before the session, mark the areas that matter. During the session, wait for price to reach them. At the zone, read participation and structure. If the pieces do not align, there is no trade. That is not missed opportunity. That is discipline doing its job.
The goal is not to catch every NQ expansion. The goal is to recognize when location, participation, structure, and risk are aligned enough to act - then protect the account when they are not.