
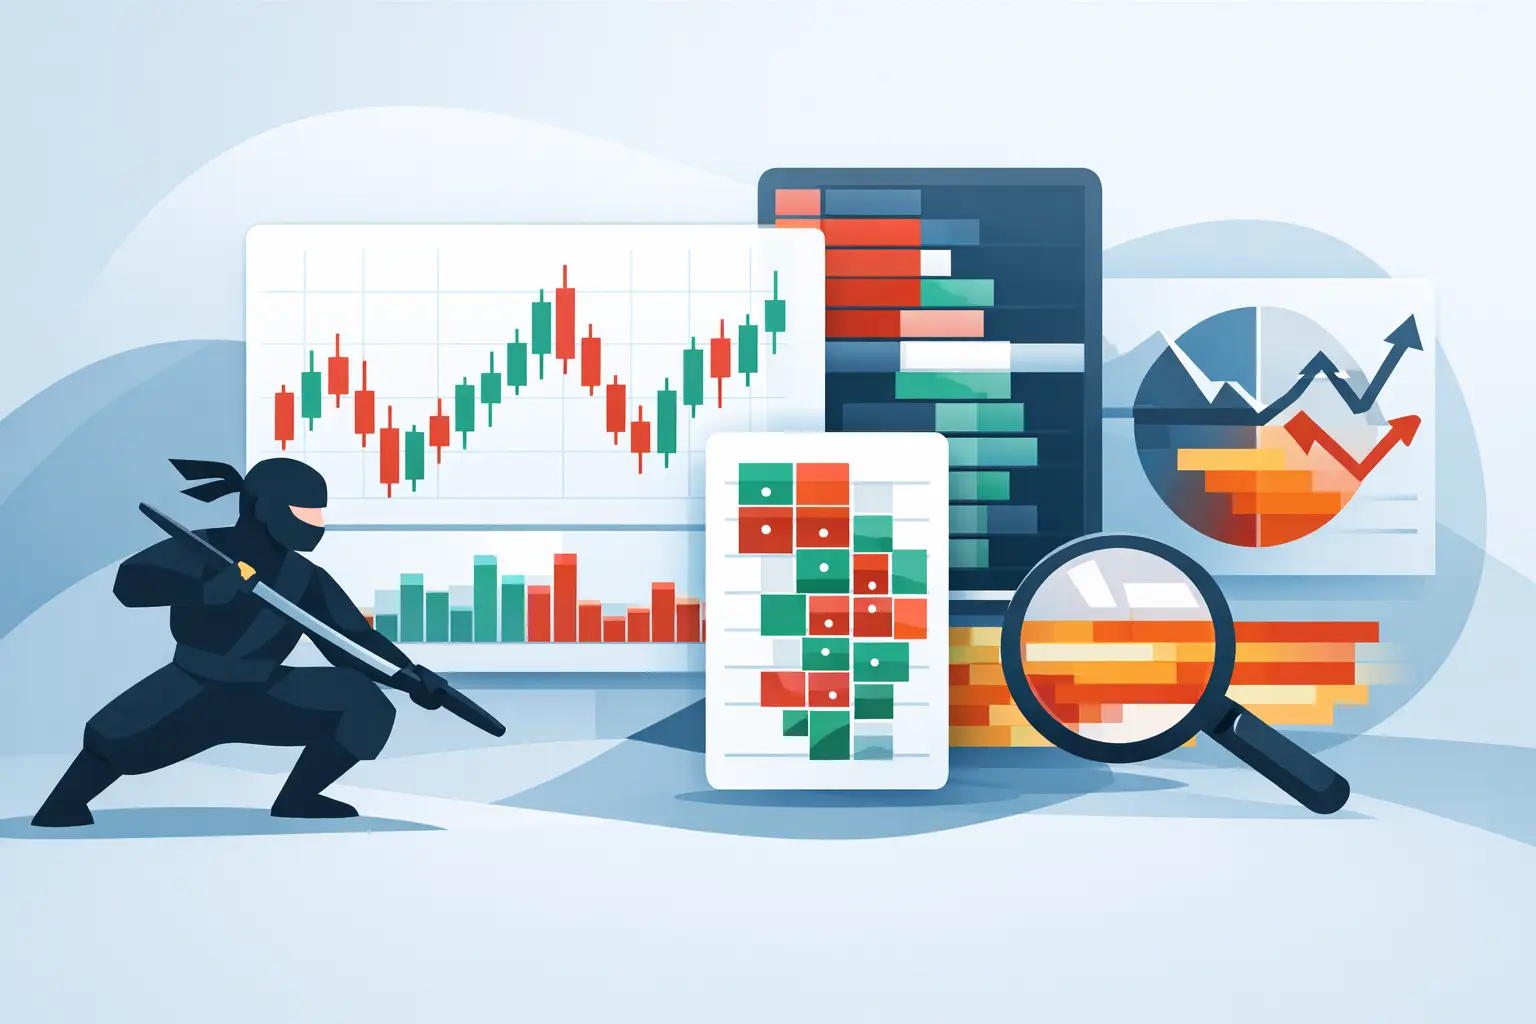
A Nasdaq futures chart can show aggressive buying at the exact moment a long becomes dangerous. That is why NinjaTrader 8 order flow indicators should not be treated as entry buttons. They are evidence tools. Used in the right location, they help you see whether participation supports the auction. Used in the middle of nowhere, they give traders one more reason to chase.
The difference is context before entry. Order flow tells you how business is being done. Auction structure tells you whether that business matters. A professional process needs both.
What NinjaTrader 8 Order Flow Indicators Actually Show
NinjaTrader 8 can display information that a standard candlestick chart compresses or hides: traded volume at price, buyer and seller aggression, bid and ask imbalances, cumulative delta, and the pace of transactions. For active futures traders, that detail can be useful because price is not random candle color. It is an auction moving between areas of accepted value and areas where value is being rejected.
But an order flow reading is not a forecast. A large positive delta does not guarantee price will rise. It may signal initiative buyers lifting offers. It may also signal buyers being absorbed by a larger passive seller. The chart only becomes readable when you know where the market is trading relative to higher-timeframe value, prior session references, and the current auction range.
That is the problem with isolated indicator use. A trader sees green delta, enters late, and blames the tool when price reverses. It is not you. It is the model. The model asked one small piece of evidence to do the work of a complete trade plan.
The Four Layers of a Useful Order Flow Process
A clean NinjaTrader workspace should answer four questions in sequence: Where is price? Who is participating? What is the trade? What invalidates it? When those answers are visible, you can trade with intention rather than reacting to every burst of volume.
1. Locate value before the open gets noisy
Start with location. Mark the areas where the market previously accepted price, rejected price, or made a meaningful transition. Session value areas, high-volume nodes, prior highs and lows, opening ranges, and clearly defined support or resistance zones all give order flow a frame of reference.
At a high-timeframe value zone, a rotation signal has meaning. At the edge of a balance, responsive participation may create a defined fade. Above a breakout level, sustained initiative participation may support continuation. In the center of a choppy range, the same signals are usually lower quality because the auction has not made a decision.
Location also defines your patience. You do not need to interpret every bar. Wait for price to reach an area where a trade makes structural sense.
2. Confirm participation, not just volume
Once price reaches a meaningful location, use order flow to judge participation. Volumetric bars and footprint-style views can show whether buyers are lifting offers or sellers are hitting bids at specific prices. Cumulative delta can reveal whether aggressive activity is aligning with price movement or failing to move price.
The useful question is not, “Is delta green or red?” Ask, “What happened after aggressive traders acted?” If buyers repeatedly lift offers at a prior high but price cannot hold above it, passive selling may be absorbing them. That is very different from a clean breakout where price accepts above the level, pulls back shallowly, and buyers continue to defend the auction.
Imbalances can help identify concentrated aggression, especially when they stack through multiple prices and occur at a structural level. Yet stacked imbalances in a thin, fast market can disappear as quickly as they print. Treat them as confirmation, not a command.
3. Design the trade before clicking
Order flow is most valuable when it helps you build a defined trade. That means identifying the entry trigger, the stop location, the first objective, and the condition that proves the idea wrong.
For example, assume NQ tests the lower edge of an established value area. Sellers push through the edge, negative delta expands, and price briefly trades below the level. If price quickly returns inside value and selling no longer produces lower prices, the failure may support a responsive long. The trade is not based on a single delta bar. It is based on location, failed acceptance below value, and evidence that the sellers lost control.
Your stop belongs beyond the point where the auction thesis fails, not at a random dollar amount chosen after entry. Your first target can be the next internal value reference, the session midpoint, or the opposite edge of a developing range. If that distance does not justify the risk, pass. Protect the account before protecting your opinion.
4. Manage the position with the same evidence
Many traders qualify an entry carefully, then manage the position emotionally. They take profits too early after a small pullback or hold losers because delta still looks favorable. Both habits ignore the original plan.
Use order flow during the trade to assess whether participation remains aligned. If a breakout is holding above its level with continued acceptance, there may be room to scale or hold for the next auction target. If aggressive buying appears but price stalls, fails to extend, and returns below the breakout level, reduce exposure or exit according to your rule set.
The goal is not to capture every point. The goal is to execute the same decision process well enough that performance is measurable.
Which Tools Earn Space on the Chart?
The best NinjaTrader 8 order flow indicators are the ones that answer a specific decision question. More tools do not create more clarity. They often create conflicting stories after the fact.
Volumetric bars are useful when you need to see volume traded at each price and compare bid-versus-ask activity within the bar. They work well for observing absorption, exhaustion, and localized imbalances near important levels. Their weakness is visual density. On a fast NQ chart, a trader can become absorbed in micro-detail and miss the larger auction.
Cumulative delta is useful for tracking whether aggressive buying or selling is building across a session or swing. Divergence between delta and price can flag a potential shift, but divergence alone is not a reversal signal. Strong trends can maintain divergence longer than a trader can maintain a bad position.
Volume profile and session profile provide the value framework that order flow needs. They help identify accepted prices, low-volume areas, and the edges where decisions are more likely. Profiles do not provide precise timing by themselves, which is why they pair naturally with execution-level order flow.
A pace-of-tape or volume burst tool can help identify urgency. It is particularly useful around scheduled news, opening-drive conditions, and breakout attempts. But fast activity is not automatically directional. The key is whether urgency produces acceptance beyond a level or gets absorbed back into the prior range.
First Light Beacon approaches this as an integrated auction-intelligence workflow: map value first, validate participation second, then define execution and risk. That sequence matters more than any individual visual study.
A Practical Setup for the Active Futures Trader
Keep the chart organized around decisions. A higher-timeframe view should show the major value zones and prior references. Your execution chart should show only the order flow data you can interpret in real time. Add a separate area for trade management levels so you know where to reduce risk, take partials, or exit.
Before the session, write down two or three likely auction scenarios. Price may open inside prior value and rotate. It may open outside value and test whether the move finds acceptance. It may drive directly into a major reference and reject. You are not predicting which one must happen. You are preparing to recognize the evidence.
During the session, avoid changing the rule because one indicator flashes. If your plan requires a reclaim of value and confirmation from participation, wait for both. If the market never offers the setup, no trade is a valid outcome.
The Mistakes That Turn Order Flow Into Noise
The first mistake is trading every imbalance. An imbalance is a footprint of aggression, not proof of control. Without location and follow-through, it is simply information.
The second is using too many timeframes and too much color. If you cannot explain a trade in one sentence before entry, the chart is probably creating confusion. A simple statement such as “Price reclaimed the lower value edge, sellers failed to hold below it, and risk is defined below the rejection low” is enough.
The third is ignoring market conditions. Order flow behavior changes between the opening drive, lunchtime compression, major data releases, and the final hour. A signal that works during balanced conditions may fail repeatedly during a news-driven trend. It depends on liquidity, volatility, and whether the market is discovering new value or rotating through old value.
The fourth is treating a stop as a failure. A planned stop is operating cost. Moving it because you want the footprint to be right is how a small, controlled loss becomes account damage.
Build Evidence, Not Excitement
NinjaTrader 8 order flow indicators can make institutional-style participation more visible, but visibility is not the same as an edge. Your edge comes from repeating a disciplined sequence: find meaningful value, wait for participation to confirm or fail, define risk before entry, and manage against the auction rather than emotion.
The next time volume suddenly surges at a level, do not ask whether you might miss the move. Ask whether the market has earned your risk. That one question keeps the chart clear, the trade structured, and the account protected.