
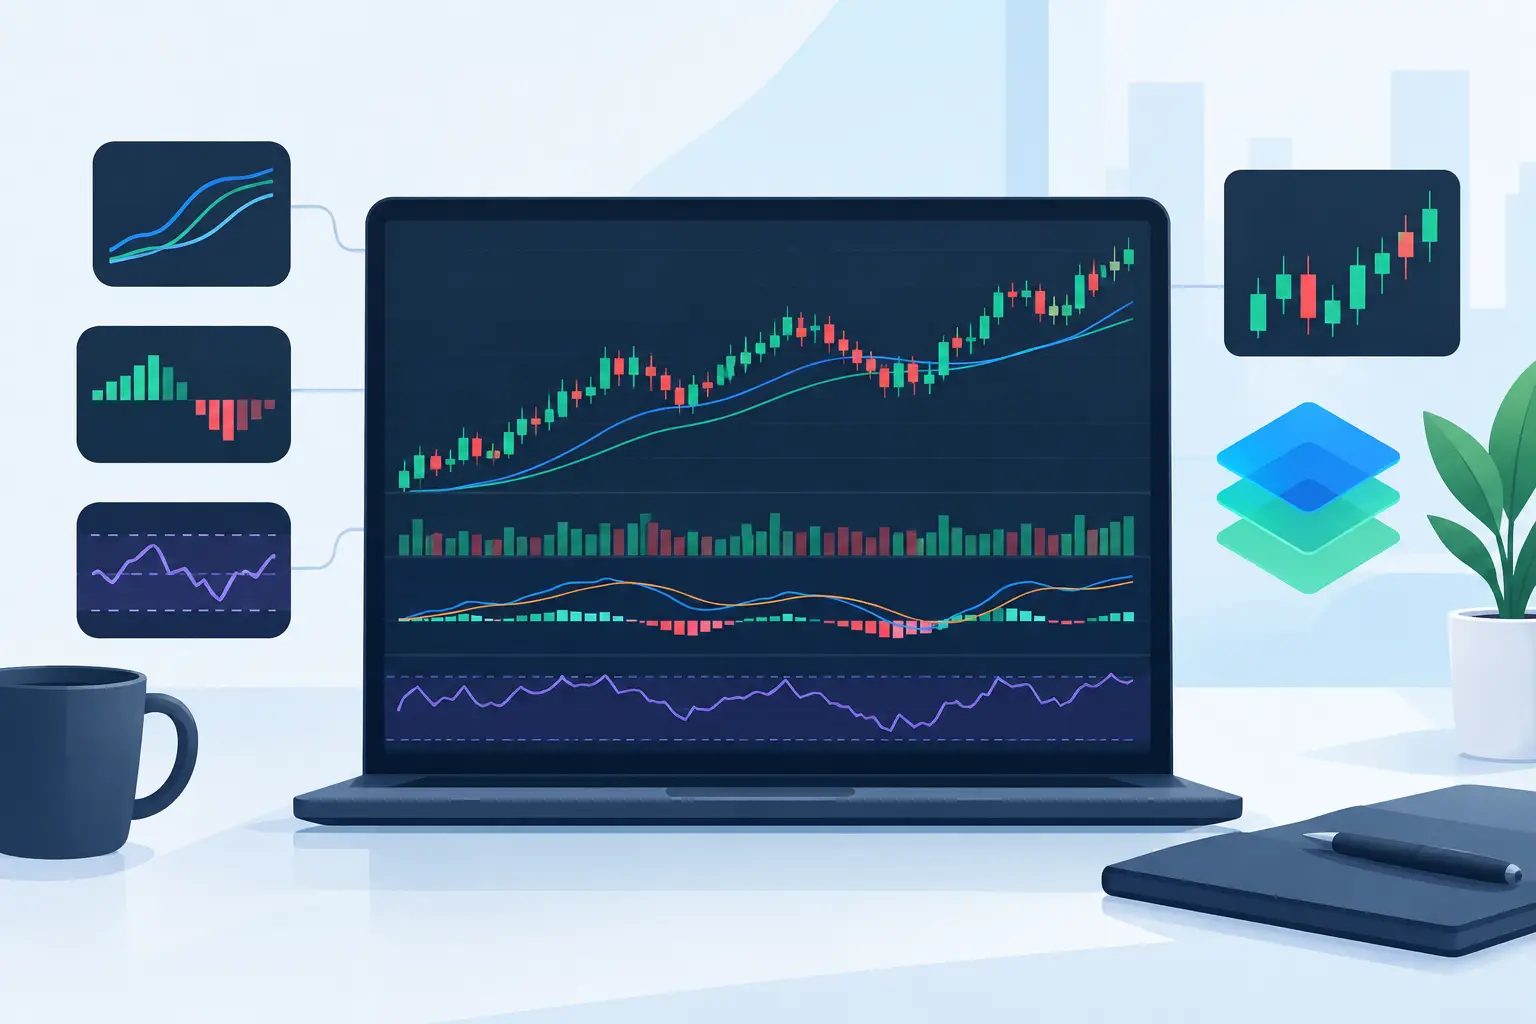
Most futures traders do not need another signal. They need a reason to care about a price before it reaches it.
That is where TradingView futures indicators either earn their place on the chart or become more noise. A moving average cross after the move, an oscillator flashing overbought at a strong auction high, or a pattern label with no reference to value can create the illusion of information. But none of it tells you whether price is trading at a meaningful location, whether participation supports the move, or where the trade is wrong.
Context before entry. That is the difference between reacting to every candle and trading with intention.
For active Nasdaq futures traders, the chart has to answer four questions in real time: Where is value? Is participation present? What is the trade structure? How much account risk is acceptable? The right indicator stack should make those answers clearer, not turn the screen into a dashboard of conflicting opinions.
What TradingView Futures Indicators Should Actually Do
A futures indicator is useful when it supports a decision process. It is not useful because it creates frequent alerts or because it paints a clean arrow after the fact.
The market auctions continuously between areas of accepted value and areas where price is being rejected or discovered. That means location matters before a trigger. A long near a meaningful lower value area has a different quality than a long taken in the middle of a balanced range. The candle may look identical. The risk and opportunity are not.
A practical TradingView futures indicator framework should help you identify higher-timeframe value, see whether price is accepting or rejecting that area, and define the distance between entry, invalidation, and target. When those pieces align, you have a trade worth considering. When they do not, standing aside is a position.
This is why a chart full of conventional indicators often fails the trader under pressure. Each tool may measure something different: trend, momentum, volatility, volume, or price action. Without a hierarchy, the trader is left negotiating with the chart. One indicator says buy. Another says sell. Price is moving, fear takes over, and the entry comes late.
It is not you. It is the model.
Start With Value, Not a Trigger
The first job of any futures chart is to establish location. Before the cash open, before the first fast move, and before the urge to chase, know the areas where the auction may matter.
Higher-timeframe value zones, prior session references, opening structures, and established acceptance areas give price a map. They do not predict that price must reverse at a level. They tell you where to pay attention and where trade structure may become favorable.
For example, Nasdaq futures may open below a prior value zone, test back into it, and fail to hold. That failure is not automatically a short. But it changes the question. Instead of buying a green candle because momentum looks strong, you can ask whether buyers are truly reclaiming value or whether the auction is rejecting the test. That distinction protects the account.
The same principle applies when price approaches a high-timeframe level after an extended move. A trader with no location framework sees momentum and enters late. A trader who understands value sees that price is arriving at a decision point. Sometimes the correct action is to trade continuation. Sometimes it is to wait for failure. Sometimes it is to do nothing until the market proves acceptance.
A good charting tool makes these locations visible without requiring you to redraw the market from scratch every morning. First Light Beacon is built around that operating idea: map the auction first, then use participation and execution tools to qualify the trade.
Value zones are areas, not magic lines
Traders often treat every level as a precise turning point. That creates bad entries and even worse stop placement. Futures markets probe. They test liquidity. They trade through obvious references before deciding whether to accept or reject the area.
Treat key levels as zones of decision. Then watch how price behaves inside and around them. Does it hold above the area and build? Does it break through, then immediately fail? Does it churn with no directional follow-through? The answer is more valuable than a line on the chart by itself.
Confirm Participation Before You Commit
Location creates attention. Participation determines whether a trade deserves capital.
A move through a level can look convincing on a small timeframe while lacking the volume, pace, or order-flow behavior needed to continue. That is why traders get trapped buying breakouts that stall two points later or fading a move that has not actually exhausted.
Participation tools should help you measure whether the market is moving with commitment. You are looking for expansion when a breakout needs expansion, responsive behavior when a rejection needs response, and a loss of drive when a trend is becoming vulnerable.
This does not mean every trade needs a perfect stack of confirmations. Waiting for perfection is another form of hesitation. It means your confirmation must match the trade idea.
A continuation trade above accepted value may require sustained participation and clean price behavior. A reversal trade at an extreme value zone may require evidence that the auction failed to hold beyond the area. Those are different conditions. Using the same trigger for both is how traders force trades into a template the market is not offering.
The practical question is simple: if you removed the indicator from the chart, would you still know why you are in the trade? If the answer is no, you are following a signal. If the answer is yes, the indicator is doing its job by supporting a defined thesis.
Design the Trade Before the Entry
The best TradingView futures indicators do not just help find entries. They help eliminate weak trade ideas before they reach the execution stage.
Once location and participation align, build the trade in plain language. Define the entry condition, the invalidation point, the first objective, and the management rule if price moves in your favor. This is where many traders lose control. They enter based on a valid observation but manage based on hope.
Say Nasdaq futures reclaim a value zone and participation increases. Your entry may be a hold above the reclaim area or a pullback that respects it. Your invalidation belongs below the level that proves the reclaim failed, not at an arbitrary dollar amount that feels comfortable. Your target should be the next meaningful auction reference, not a random number selected after you are already in.
The size of the stop is not the issue by itself. The relationship between the stop and the expected opportunity is the issue. If the required invalidation is too far away for the available target, there may be no trade. That is not missed opportunity. That is risk control working correctly.
Use indicators to reduce decisions during the trade
Execution gets harder once money is on the line. A clear on-chart framework can reduce the number of emotional decisions you must make while the market is moving quickly.
If the trade is designed around holding a reclaimed level, then a failure back below that level matters. If the plan calls for taking partials into a known opposing zone, then follow the plan when price arrives. If participation fades before the target, you may need to protect gains rather than demand a full extension.
There is no single management rule that fits every session. Trend days, balanced days, and event-driven sessions require different expectations. But every session rewards traders who know the condition that keeps them in and the condition that gets them out.
Avoid the Indicator Stack Trap
More indicators do not create more clarity. They often create more excuses.
A chart overloaded with moving averages, oscillators, pivot systems, volume tools, and alert scripts can make every trade look justified. One tool will almost always agree with what you want to do. That is not confirmation. That is confirmation bias with extra colors.
A disciplined stack has a clear sequence:
- Locate higher-timeframe value and key decision zones.
- Confirm whether participation supports acceptance, rejection, or continuation.
- Define entry, invalidation, target, and size before execution.
- Manage risk according to the structure, not the emotion of the last candle.
Each layer has a job. If two indicators perform the same job, remove one. If a tool cannot change your decision, it is probably decoration.
This is especially important for scalpers. Speed does not excuse a lack of structure. A fast trader still needs to know whether they are scalping into resistance, buying from a favorable location, or taking a low-quality trade in the center of noise. The faster the instrument moves, the more valuable a simple decision hierarchy becomes.
The Real Edge Is a Repeatable Process
No indicator can guarantee a winning trade. Futures markets are uncertain by nature, and any tool that promises certainty is selling excitement instead of process.
What a well-built framework can do is improve the quality of your decisions. It can stop you from chasing price away from value. It can show you when a breakout lacks participation. It can define risk before a losing trade expands into an account problem. It can make the difference between trading all day and waiting for one or two conditions that actually fit your plan.
Use your TradingView chart as an operating station, not a slot machine. Map the auction. Let participation qualify the idea. Build the trade before the click. Then let risk control do its job.
The market will always offer another candle. Your account does not need to respond to every one.