
First Light Beacon
The flagship implementation of the Dynamic FLB Zone methodology. Value zones, regime detection, momentum confirmation, and signal generation in a single tool—engineered to make higher-timeframe auction structure easier to read.

Don't trade price. Trade value.
Traders often react to the latest printed price without first locating it inside a broader auction. Price records where the latest transaction occurred; context comes from comparing that print with a defined session, range, and value structure.
First Light Beacon organizes that comparison around a product-defined value zone. Above, inside, and below the zone are location states. They do not identify who traded, reveal participant motives, or certify fair value.
Moving averages, RSI, and FLB zones transform market data in different ways. FLB's distinction is its auction structure: a zone, midpoint, boundaries, completed references, regime, and optional participation context organized from the configured market window.
New to the mechanics behind the map? Read the source-linked guide to why futures prices move and how FLB organizes the auction.
Where is price? Above the Buy Line, inside the zone, or below the Sell Line?
Where is the zone? Shifting up, shifting down, or staying put?
How is price responding? Accepting outside, rejecting back through a boundary, or rotating inside?
A three-line value structure
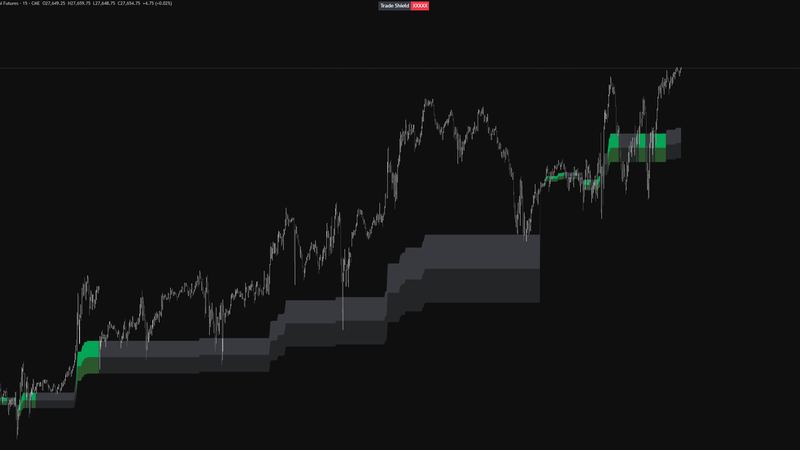
The Dynamic FLB Zone is the core of the methodology—three lines that adapt as the market trades, giving you a live read on where the product-defined auction range is developing.
Upper Boundary
Marks the upper boundary of the product-defined value zone. Price above it is classified as an outside-above location state for the current zone window.
Above the Buy Line: bullish posture. Bias is long. Pullbacks into the zone are potential entries. A close back below invalidates it.
The Balance Point
The midpoint that bisects the zone. Inside the zone, it supplies a consistent reference for classifying price above or below the center of the current range.
Above mid: slight long bias. Below mid: slight short bias. The intra-zone tiebreaker.
Lower Boundary
Marks the lower boundary of the product-defined value zone. Price below it is classified as an outside-below location state for the current zone window.
Below the Sell Line: bearish posture. Bias is short. Rallies back into the zone are potential entries. A close back above invalidates it.
Three positions, three playbooks
Before you can trade the zones, you have to read them. Every bar tells a story — your job is to learn to hear it.
Bullish product posture. Evaluate continuation-long and zone-retest conditions only when they also satisfy your higher-timeframe, invalidation, and risk rules.
Product-defined balance. The middle offers less boundary-response information, so the framework emphasizes observation until price reaches an edge or another planned condition qualifies.
Bearish product posture. Evaluate continuation-short and zone-retest conditions only when they also satisfy your higher-timeframe, invalidation, and risk rules.
Turn the individual lines off and leave the Zone Fill on for a cleaner chart. The fill alone tells you most of what you need at a glance — you can still see where the edges are.
Seven repeatable patterns
FLB trading reduces to seven patterns. These aren't exhaustive — but every trade you take should be traceable back to one of them.
The Breakout Entry
The Retest Entry
The Zone Flip
The Rejection Fade
The End Cap Retest
Zone-on-Zone Confluence
Trend Continuation
Retest entries typically have tighter stops than breakouts — better risk/reward. If you're early in your FLB journey, focus on retests over pure breakouts. The patience pays.
Every input, explained
First Light Beacon ships with calibrated defaults. Most traders never need to change them — but every input is documented here for full control when you want it.
Zone Settings
| Sensitivity Default 4 | Controls zone tightness. Lower = tighter zones (more signals, more noise). Higher = wider zones (fewer signals, stronger confirmation). Default 4 is the calibrated FLB standard — leave it there unless you understand the implications. |
| Trade Mode | Session = named session zones (NY, London, etc). Time Based = rebuilds zones on any timeframe (1m, 5m, 15m, 1H, 1D). |
| Named Session Zones | When in Session mode: choose which session anchors the zone. Options include New York, London, Asia, US Premarket, 3:50 Algo, and Initial Balance. |
| Time Based Interval | When in Time Based mode: how often zones rebuild. Common choices — 5min for scalping, 15min for intraday, 60min for swing, 1D for positional. |
| Show Buy / Sell / Mid Line | Individual toggles for each boundary. Turn off for a cleaner chart, or on when you need precision. |
| Show Dynamic Zone Fill | Master toggle for the shaded zone body. Keep this on even when lines are off — the fill alone communicates everything. |
| Zone Coloring Mode | Legacy = static gradient. FLB Regime = green/red/gray based on bias. Order Flow = conviction-based coloring (Premium). |
| Show End Caps | On/off for completed previous zones carried forward as reference context. Keep them visible when prior auction locations are part of your process. |
Trade Shield
| Enable Trade Shield | Master on/off for the entire module. |
| Dim Candles During NO TRADE | Visually dims candles when shield is in NO TRADE state. Reinforces the no-trade message at a glance. |
| Stats Lookback Days Default 100 | How many days of daily zone data Trade Shield uses for regime calculation. Calibrated; only change with specific reason. |
Volume Dots
| Lookback (bars) Default 200 | How many bars back to compute the volume baseline. Default covers most intraday timeframes. |
| Volume StDev Length Default 50 | Standard deviation window. Calibrated. |
| Show Volume Dots | Master on/off for the dots. |
| Show Volume Labels on Extremes | Adds numeric volume labels on extreme bars. |
| Extreme Threshold Default 3.0 | Multiple of StDev for "extreme" classification. Default = 3-sigma event. |
| Show ONLY Dots ≥ Extreme Threshold | When on, hides ordinary-volume dots entirely. Keep on for clean charts. |
Candle Color
| Off | Use TradingView's native red/green candle coloring. |
| RSI-Based | Colors candles by RSI position. Above 60 bullish, below 40 bearish, transitional shades between. |
| Triple-EMA Slope Default | Colors candles by smoothed EMA slope. The FLB default produces fewer color changes and a more stable displayed directional state. |
| Volatility-Adjusted | Advanced. Colors based on price movement relative to volatility with adaptive thresholds. Steep learning curve. |
Three modes, three reads
The zone displays product-defined value location. Its coloring displays the selected regime or footprint-delta state inside that structure.

Legacy
Classic static gradient fill. Cosmetic, not informational. Best for busy charts with multiple tools where you want a minimal visual footprint.

FLB Regime
The fill color changes with the regime: green when bullish, red when bearish, gray when neutral. Best for day trading and single-glance directional bias.

Order Flow PREMIUM
Uses footprint delta data to color the zone by measured delta state and flags when the configured structure and flow states diverge.
Order Flow Mode — Eight States
Order Flow mode requires TradingView Premium or Ultimate for footprint data. On lower tiers, First Light Beacon gracefully falls back to FLB Regime coloring — no error, just reduced fidelity.
Twenty alert conditions
First Light Beacon exposes a comprehensive set of alert conditions through TradingView's Add Alert dialog. Use these to get notified of key events without watching the chart continuously.
Zone Events
End Cap Events
Beacon & Trade Shield
Signal Engine
Order Flow Events
A focused alert set to start with is Trade Shield transitions, Buy/Sell Line Rejection, and End Cap Rejection. Together they cover regime changes, active-zone edge responses, and completed-zone responses without turning every displayed state into an alert.
What to avoid
These are recurring workflow mistakes reported during early FLB use. Reviewing them up front helps you practice the same auction vocabulary more consistently.
Trading the middle of the zone
Inside the zone, the product is displaying balance and no boundary response has qualified. The zone edges provide a clearer location for evaluating acceptance or rejection; use the middle only when your plan defines a separate condition there.
Fighting the zone shift
Shorting because "it's overbought" while the zone is shifting up puts the idea against the displayed auction structure. Define what would invalidate that read instead of treating an oscillator label as enough context.
Ignoring higher timeframe context
A 5-minute long that runs directly into the 1-hour Sell Line can carry conflicting higher-timeframe context. Check at least one timeframe up, then apply the conflict rule already defined in your plan.
Stops that don't match setups
A breakout long with a stop at the Sell Line is not a breakout — it's a swing trade with different risk. Match your stop to your setup. Not "2 ticks away to give it room."
Overtrading inside sessions
More displayed events do not establish more qualified opportunities. Define your setup criteria and session limits before the market opens, then allow zero trades when those conditions never appear.
Not using end caps
End caps preserve locations where the product previously completed an auction zone. Treat a later first-touch response as context to observe—not automatic support, resistance, or an entry signal.
Confusing rejection with fake-out
Price trades briefly above the Buy Line and closes back inside. Classify the response using the documented close-back rule, volume context, and higher-timeframe zones rather than inferring who caused the intrabar move.
Mental capital erosion
Three losers in a session, then forcing the next trade to "make it back." Stop. Re-read the zone. Don't trade to escape — trade to execute.
Open chart. Run the checklist.
A simple pre-trade routine that gets the framework working for you on every session.
The Daily Checklist
Check Trade Shield — BULLISH, BEARISH, or NO TRADE?
Note current zone position — ABOVE, INSIDE, or BELOW?
Check higher-timeframe zone — does it agree?
Identify nearest end caps — are they in your path?
Wait for setup — one of the seven core setups at a zone edge.
Confirm with Beacon Line + Volume Dots.
Enter with structural stop — where does your thesis become wrong?
Apply the position-size and risk limits defined in your plan; a product grade does not determine size by itself.
Manage the trade — honor your stop, trail on zone structure.
The Don't List
Frequently asked
The zone logic can be applied to supported chart symbols with sufficient price history, including futures, stocks, ETFs, forex, and crypto. Data quality, sessions, liquidity, and volatility differ by market, so zone behavior will differ; validate the specific symbol, feed, and settings before use.
Choose a chart and source timeframe that matches the market horizon you are studying. Examples such as 1–5 minute, 5–15 minute, or longer-period charts are starting configurations, not universal trading recommendations. Validate the selected combination in replay or simulation before live use.
Session mode organizes named-session context such as the New York or London open. Time Based mode uses a selected recurring timeframe. You can display separate instances when both views are useful, but additional overlays can increase chart complexity; choose the mode that matches a documented workflow.
Sensitivity controls how tight the zones are around the actual price range. Lower (1–2) produces tighter zones, so more small moves qualify as breaks. Higher (8–10) produces wider zones, so breaks qualify less often under the product definition. Default 4 is the documented starting point; changing it significantly alters how the system behaves.
Three possible reasons: (1) "Show End Caps" is disabled, (2) no prior zones have been built yet — end caps only appear after at least one zone has ended and a new one started, (3) end caps mitigate (delete) when price has fully traded through them. In a strong trend, end caps can mitigate quickly. This is normal.
First Light Beacon is an indicator rather than a complete strategy, so a meaningful backtest requires explicit entry, exit, position-sizing, cost, and risk rules. Alerts or custom strategy logic can be studied separately. Historical or simulated results do not guarantee live execution or performance.
First Light Beacon can expose supported alerts or product states for a separately configured workflow. Automation still requires independent execution logic, risk controls, monitoring, platform connectivity, and testing. The indicator does not place or guarantee orders by itself.
Zones are dynamic — they rebuild based on the current day's price action within each session anchor. Yesterday's zones are captured as end caps (if enabled). FLB shows you where value is right now, not where it was historically. For persistent reference levels, use end caps.
See the auction through one connected map.
First Light Beacon is the structural foundation of the framework—built to keep product-defined auction value and its higher-timeframe context visible on the chart.