
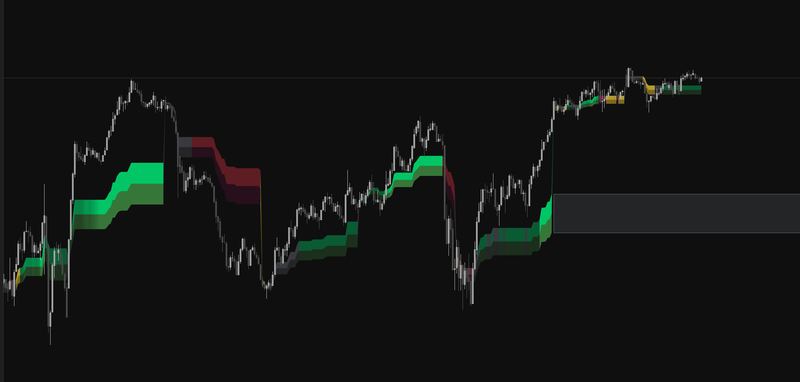
A candle summarizes the open, high, low, and close for an interval; it does not preserve the full sequence of trades or changes in displayed depth. CME’s chart-types lesson reviews that OHLC construction. This distinction is the starting point for understanding futures order flow—and for using an auction map without turning it into a prediction.
What actually makes a futures price move?
Futures prices move through a continuous exchange auction. Participants add, modify, cancel, and execute orders at bids and offers. A quote can change when resting orders change; the last-traded price changes when the next execution occurs at a different price.
Marketable orders demand available liquidity. If enough quantity is available or quickly replenished at the current price, substantial activity can occur without the last price advancing. If available liquidity changes or is consumed, the next execution may occur at another price. News matters because it changes what participants are willing to bid, offer, or trade immediately—not because a candle pattern mechanically moves the market.
First Light Beacon is designed to reduce the translation work between that auction and the chart. It keeps a product-defined zone, its boundaries and midpoint, price response, visual regime, and available participation context in one chart language. That can make the learning sequence more concrete and consistent; it is not a promise that every trader will learn faster or achieve a trading result.
Price discovery is a continuous auction
The Commodity Futures Trading Commission defines price discovery as determining a commodity’s price level through the interaction of buyers and sellers under supply-and-demand conditions. CME Group describes the futures market as an auction-type environment in which bids and offers change as participants respond to information. Read the CFTC definition of price discovery and CME’s price-discovery lesson.
On CME Globex, entered, modified, and canceled orders are organized into a central limit order book. Displayed resting orders represent buying or selling interest at particular prices. An incoming order that can trade immediately matches against available quantity according to the product’s exchange rules. CME explains the central limit order book and matching process.
Participants enter, modify, or cancel bids and offers as information and risk change.
A marketable order trades against compatible resting quantity at an available price.
Quantity can remain, refresh, disappear, or be consumed at the current level.
Quotes reflect the current book; the last price reflects the latest completed trade.
If every trade has a buyer and seller, what is buying pressure?
Every completed futures contract has a buyer and a seller. “Buying pressure” does not mean a trade occurred without a seller: buy-side aggressors submit marketable orders against available offers. Sell-side aggressors submit marketable orders against available bids. If buy-side demand repeatedly meets available or replenished supply at the same offer, price can remain there. If that supply is no longer available, later executions can occur higher. The reverse applies on the bid. A CFTC-hosted research paper—not a Commission rule or guidance document—similarly separates the long/short buyer-and-seller labels from the liquidity-taking aggressor label.
CME’s liquidity research distinguishes passive participants supplying resting orders from aggressing participants demanding liquidity. It also warns that visible depth alone does not describe the whole liquidity picture because quoting can refresh quickly. Review CME’s liquidity analysis.
A candle, the order book, order flow, and an auction map answer different questions
Confusion starts when one display is asked to prove something it cannot observe. These four layers can complement one another, but they are not interchangeable.
| Layer | What it shows | What it cannot establish |
|---|---|---|
| Candlestick | Open, high, low, and close for a chosen interval. | The complete order interaction or why a participant acted. |
| Market depth | Displayed resting bid and offer quantity across available price levels. | That an order will remain, execute, or reveal its owner’s intent. |
| Executed order flow | Completed trade activity classified by a platform’s available data and method. | Participant identity, motive, or the next price. |
| Auction map | A chosen framework for organizing price location, activity, and response over a defined window. | An exchange-certified fair value or guaranteed direction. |
NinjaTrader describes order-flow tools as ways to examine how buyers and sellers interact, including executed trades, resting orders, liquidity, cumulative delta, imbalances, and volume profiles. It also states that order flow is reactive rather than predictive and should be interpreted with broader context. Read NinjaTrader’s order-flow guide.
“Value” is a framework term—not one universal exchange number
Traders use “value” in several ways. A Volume Profile can define a value area as a configurable portion of traded volume around a profile. Another method may organize a session’s range, time, or activity differently. Those are analytical constructions. The exchange publishes orders and trades; it does not certify one chart study’s zone as the market’s only fair value.
NinjaTrader’s Volume Profile documentation, for example, distinguishes last-traded volume profiles, price profiles, tick profiles, a point of control, and a configurable value area. That is useful context, but it does not make every tool that uses the word “value” a Volume Profile. Review NinjaTrader’s Volume Profile concepts.
Keep exchange mechanics and interpretation separate. “Acceptance” can describe repeated trade or sustained price behavior within an analytical window. “Rejection” can describe an interaction followed by movement back away. Neither word identifies the trader on the other side or guarantees what happens next.
How FLB turns auction questions into one chart language
First Light Beacon is an integrated, auction-first chart tool for TradingView and NinjaTrader 8. Its central design choice is to organize several reading questions around the same active location instead of making the trader translate between unrelated studies.
Active zone and references
FLB builds a product-defined zone from a selected named session or time interval. The zone presents an upper boundary, lower boundary, and midpoint, while End Caps preserve completed-zone boundaries until price has crossed both edges.
Price relative to the map
The chart makes it easier to ask whether price is above, inside, or below the current zone and how that location relates to the displayed bullish, bearish, or no-trade regime.
Hold, rejection, or acceptance
FLB can mark a defined boundary interaction followed by a close back across that boundary. A continuing move outside the zone is different from that product-defined rejection.
Flow in the active context
On NinjaTrader 8, Order Flow mode can place tick-classified executed activity, cumulative flow, imbalance, and divergence context into the zone read when the required data is available.
The visual regime can alert when it changes and can dim candles in a no-trade state. It is chart guidance only: it does not submit, block, or close orders. It is also distinct from the separate Trade Shield account-governance product.
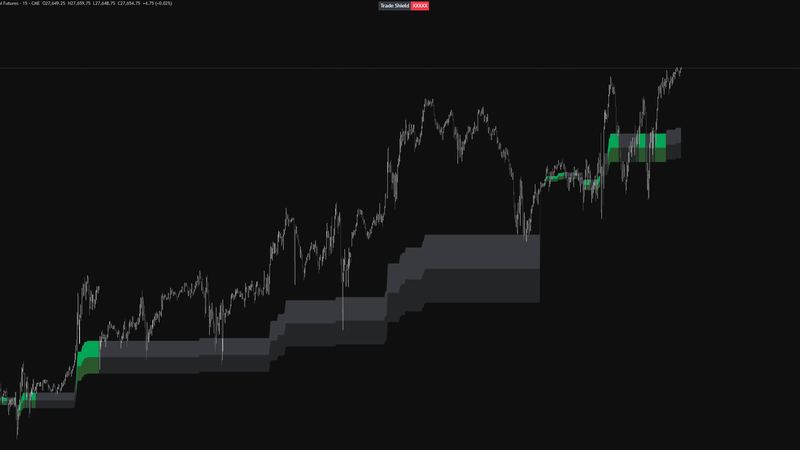
What FLB’s NinjaTrader order-flow view is actually reading
The current NinjaTrader implementation uses completed last-trade events rather than a DOM reconstruction. When suitable tick events are available, it classifies trades at or above the current ask as buy-side activity, at or below the current bid as sell-side activity, and divides in-spread volume between the two classifications. It then organizes that executed activity by price row and active zone for its displayed delta, conviction, imbalance, and divergence context.
This does not prove who traded, why they traded, or that an “institution” defended a price. It is a product-defined reading of observable transactions. If the required NinjaTrader tick events are unavailable, FLB uses a bar-based approximation and shows a warning; that approximation is not equivalent to tick-classified order flow.
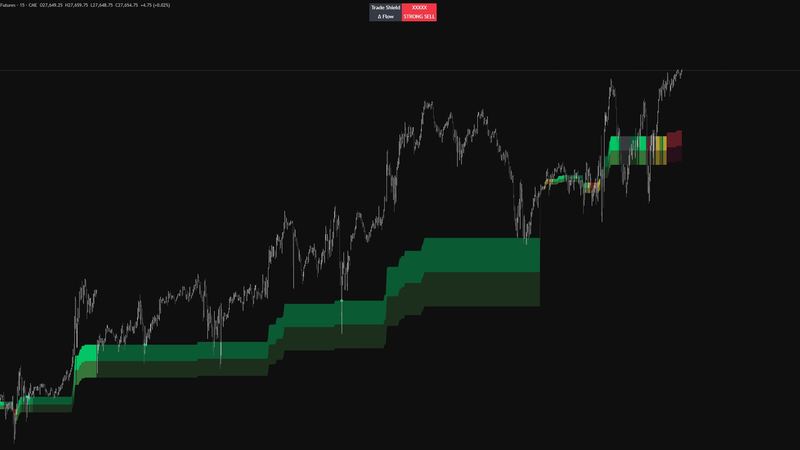
Why an integrated map can make the auction easier to study
Learning gets harder when each chart panel uses different terminology, time windows, and visual priorities. FLB’s practical advantage is not omniscience or guaranteed accuracy. It is a consistent hierarchy that keeps four questions connected to one location.
Identify the active zone, its upper and lower boundaries, midpoint, and relevant completed context.
Describe price above, inside, or below the zone and note the current visual regime.
Separate a product-defined close-back rejection from continued acceptance outside the boundary.
When valid data is available, compare the executed-flow classification with location and response.
This sequence can reduce chart-hopping and make review more consistent because the vocabulary stays the same from observation to observation. First Light Beacon has not published a controlled study measuring learning time, so the responsible claim is that the interface is designed to reduce separate chart-reading questions—not that it will shorten every trader’s learning curve by a known amount.
Order flow is useful context—not a view into intent
- Displayed market depth can change when orders are entered, modified, or canceled. A large displayed order is not a promise that it will remain or execute.
- Executed-flow classifications depend on the data, provider, platform, history, and method used. Historical and real-time output can differ when the underlying data differs.
- The NinjaTrader implementation is not a DOM or resting-liquidity reconstruction. It organizes executed last-trade activity when the required events are available.
- The TradingView edition is live and invite-only for eligible memberships, but its private source is not part of this review. Do not assume identical calculations or feature parity across platforms.
- FLB does not identify institutions, read motives, prove causality, or forecast the next transaction.
- A zone, regime, rejection, delta, or imbalance is decision support. None guarantees a fill, direction, or trading result.
For the underlying platform boundaries, compare NinjaTrader’s documentation for Level 1 market-data events, real-time Level 2 depth events, and Tick Replay and provider substitutions. TradingView separately documents what its Level 2 view represents, broker and availability limits, and the platform-specific footprint data model.
Reactive, not predictive: NinjaTrader’s own order-flow education describes order flow as a way to interpret activity as it unfolds, not as a prediction of future prices. Use it to make a current observation more specific, then define risk independently.
A simple simulation study routine
Use one liquid futures contract, one session, and one stable chart configuration. The objective is not to find a signal on every bar. It is to practice describing the same auction consistently.
- Before the observation: write down the active zone, midpoint, boundaries, and displayed regime.
- At the boundary: record whether price closed back across it, remained outside it, or moved through without a defined rejection.
- With suitable flow data: note whether the executed-flow classification agreed with, diverged from, or added no useful information to the response.
- Afterward: review what happened without rewriting the original observation. The goal is precise recognition, not hindsight certainty.
- Repeat in simulation or replay: keep the same vocabulary and settings long enough to compare similar conditions.
Simulation cannot reproduce every live fill or behavioral pressure, but it allows a learner to separate chart-reading practice from financial risk. Review the First Light Beacon framework guide for the broader locate, confirm, define, and protect workflow.
Futures price movement and FLB FAQ
Why do futures prices move?
Futures prices are discovered through the interaction of bids, offers, new orders, modifications, cancellations, and executions. A quote can change as resting orders change; the last-traded price changes when a new execution occurs at a different price.
If every trade has a buyer and seller, how can buying pressure move price?
Every completed contract has both sides. Buy-side aggressors submit marketable orders against available offers; sell-side aggressors submit marketable orders against available bids. If available or replenished sell quantity absorbs buy-side demand, price can remain at the same level; if it does not, later executions can occur at higher available prices.
What is order flow in futures trading?
Order flow is the study of how orders enter, change, interact, and execute. Different tools show different parts of that process, including market depth, time and sales, bid-and-ask-classified trades, delta, imbalances, and volume profiles.
What is the difference between market depth and executed order flow?
Market depth shows displayed resting bids and offers that can be changed or canceled. Executed order flow describes completed trades using the platform and data provider’s available classification method. Neither reveals participant identity or guarantees what happens next.
What does value mean in First Light Beacon?
Value in FLB is a product-defined auction zone built from the configured session or time window. It provides an upper boundary, lower boundary, and midpoint for organizing location and response. It is not an exchange-certified fair price or a promise that price must return.
Is First Light Beacon a Volume Profile or footprint chart?
No. FLB is an integrated auction-context indicator with its own Dynamic Zone, completed-zone references, Beacon line, visual regime, and optional flow context. A standard Volume Profile or footprint uses a different defined data construction, although those tools can be studied alongside FLB.
How can FLB make auction concepts easier to learn?
FLB is designed around one repeatable sequence: locate the zone, describe price relative to it, classify the response, and then evaluate available participation context. Keeping those questions in one visual hierarchy can make practice more concrete and consistent, but learning time varies by trader.
Does FLB identify institutional traders or orders?
No. FLB can organize observable price, trade, and product-state data. It does not identify the person or institution behind a transaction, determine motive, or prove that a particular participant defended a level.
Does order flow predict the next price move?
No. Order-flow tools describe current or completed activity using the data they receive. They can add context to a decision, but they do not know future orders and cannot guarantee the next direction.
Does FLB work the same way on TradingView and NinjaTrader 8?
First Light Beacon is available for eligible users on both platforms, but platform data, interfaces, and implementations differ. Do not assume identical calculations, historical coverage, or order-flow behavior across TradingView and NinjaTrader 8.
Does First Light Beacon guarantee accuracy or reduce learning time?
No. FLB is designed to make auction questions more connected and readable, but it does not guarantee accuracy, a faster learning outcome, profitable trades, fills, or protection from loss.
Should a beginner practice with simulation first?
Yes. Simulation or replay can help a learner practice the same location, response, and participation vocabulary without placing a live trade. Simulated results still do not reproduce every live fill, latency condition, or emotional decision.
Sources and further reading
- CFTC: Futures glossary and price discovery
- CME Group: Price Discovery
- CME Group: Central limit order book and trade matching
- CME Group: Assessing liquidity and book depth
- CME Group: Electronic order-book methodology
- CME Group: Candlestick, line, and bar chart construction
- CFTC-hosted research: Aggressors, liquidity providers, buyers, and sellers
- NinjaTrader: Order Flow and Indicators for Futures Traders
- NinjaTrader: Order Flow Cumulative Delta
- NinjaTrader: Order Flow Volume Profile
- NinjaTrader: OnMarketData Level 1 events
- NinjaTrader: OnMarketDepth Level 2 events
- NinjaTrader: Developing for Tick Replay
- TradingView: Volume footprint data in Pine Script
- TradingView: Volume Footprint charts guide
- TradingView: Level 2 data
- TradingView: Level 2 availability
- First Light Beacon product documentation
This guide was prepared by the First Light Beacon Product Team with AI-assisted research and drafting. Exchange and platform statements were checked against the linked primary sources. Product statements were checked against the current published product record and source-inspected NinjaTrader behavior; proprietary formulas and thresholds remain private. Platform capabilities and product behavior can change, so confirm current documentation and data requirements.
NinjaTrader is a registered trademark of NinjaTrader Group, LLC. TradingView is a trademark of TradingView, Inc. First Light Beacon is not affiliated with or endorsed by either company.